Angular Google 图表 - 组合图
组合图表有助于将每个系列呈现为以下列表中的不同标记类型:折线图、面积图、条形图、烛台图和阶梯式面积图。 要为系列分配默认标记类型,请使用 seriesType 属性。 Series 属性用于单独指定每个系列的属性。 以下是显示差异的柱形图示例。
我们已经在 Google 图表配置语法一章中了解了用于绘制图表的配置。 现在,让我们看一个显示差异的柱形图示例。
配置
我们使用ComboChart类来显示组合图表。
type='ComboChart';
示例
app.component.ts
import { Component } from '@angular/core';
@Component({
selector: 'app-root',
templateUrl: './app.component.html',
styleUrls: ['./app.component.css']
})
export class AppComponent {
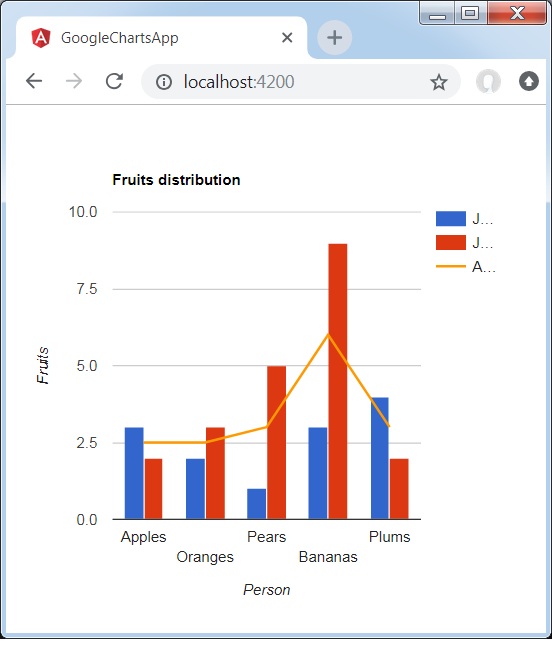
title = 'Fruits distribution';
type = 'ComboChart';
data = [
["Apples", 3, 2, 2.5],
["Oranges",2, 3, 2.5],
["Pears", 1, 5, 3],
["Bananas", 3, 9, 6],
["Plums", 4, 2, 3]
];
columnNames = ['Fruits', 'Jane','Jone','Average'];
options = {
hAxis: {
title: 'Person'
},
vAxis:{
title: 'Fruits'
},
seriesType: 'bars',
series: {2: {type: 'line'}}
};
width = 550;
height = 400;
}
结果
验证结果。